Market Outlook
September 19, 2017
Market Cues
Domestic Indices
Chg (%)
(Pts)
(Close)
Indian markets are likely to open in red tracking global indices and SGX Nifty.
BSE Sensex
0.5
151
32,424
The US stock markets climbed on Monday, with the S&P 500 index and the Dow
Nifty
0.7
68
10,153
industrials closing at all-time highs for a second straight session, ahead of the start
Mid Cap
0.7
117
16,090
of a key gathering of the Federal Reserve. However, technology stocks lagged
behind, limiting gains for the Nasdaq Composite Index. The Dow Jones Industrial
Small Cap
0.9
146
16,834
Average rose 0.28% to 22,331, while S&P 500 index advanced 0.2%, to 2,503
Bankex
0.7
198
28,176
meanwhile the Nasdaq Composite, finished up 0.1%, at 6,454.
Global Indices
Chg (%)
(Pts)
(Close)
Amid decelerating momentum of pound on the currency markets, FTSE 100 the
blue-chip index rebounded from its four-month low to rise 37.8 points to 7,253. The
Dow Jones
0.3
63
22,331
index was given a late boost by Bank of England Governor Mark Carney, who in his
Nasdaq
0.1
6
6,455
speech at the IMF in Washington warned of a limited and gradual pace to interest
FTSE
0.5
38
7,253
rates rises.
Nikkei
1.4
288
20,198
India’s Nifty index closed at a lifetime high on Monday, riding a wave of liquidity
Hang Seng
(0.1)
(32)
28,127
that lifted global markets, ahead of a key meeting of Federal Reserve officials.
Shanghai Com
(0.1)
(2)
3,361
Expectations that the Fed will leave rates unchanged and an unwinding of tensions
over North Korea’s provocative missile tests helped investor sentiment. The Nifty
closed at a record 10,153, up 0.7% while the Sensex ended 0.5% high to 32,424.
Advances / Declines
BSE
NSE
Advances
1,554
1,042
News Analysis
Declines
1,116
666
Dixon technologies: Book profit
Unchanged
152
76
Detailed analysis is on Pg2
Volumes (` Cr)
Investor’s Ready Reckoner
BSE
4,285
Key Domestic & Global Indicators
NSE
28,774
Stock Watch: Latest investment recommendations on 150+ stocks
Refer Pg7 onwards
#Net Inflows (` Cr)
Net
Mtd
Ytd
Top Picks
FII
(931)
(3,529)
43,75
CMP
Target
Upside
Company
Sector
Rating
MFs
845
5,119
74,00
(`)
(`)
(%)
Blue Star
Capital Goods
Accumulate
786
807
2.6
Dewan Housing FinanceFinancials
Accumulate
602
610
1.3
Top Gainers
Price (`)
Chg (%)
Asian Granito
Others
Accumulate
470
495
5.4
Rtnpower
6.57
9.32
Navkar Corporation
Others
Buy
194
265
36.5
Bfutilitie
425.95
8.95
KEI Industries
Capital Goods
Accumulate
336
371
10.3
More Top Picks on Pg5
Infibeam
158.90
8.32
HCL-Infosys
52.40
8.15
Key Upcoming Events
Previous
Consensus
JustDial
41.40
6.65
Date
Region
Event Description
Reading
Expectations
Sep 19, 2017 US
Housing Starts
1,155.00
1,174.00
Top Losers
Price (`)
Chg (%)
Sep 19, 2017 US
Existing home sales
5.44
5.46
Sep 20, 2017 US
Building permits
1,230.00
1,220.00
Jpassociat
18.60
(8.60)
Sep 20, 2017 US
FOMC rate decision
1.25
1.25
Religare
47.25
(4.74)
Sep 21, 2017 Germany PMI Services
53.50
53.70
Geship
398.85
(4.38)
More Events on Pg7
Divislab
833.75
(4.03)
Fconsumer
62.50
(3.47)
#as on 18th Sep, 2017
Market Outlook
September 19, 2017
News Analysis
Dixon technologies: Book profit
We had recommended subscribing the shares of Dixon technologies IPO, despite
its higher valuation (at higher band, 38.0x of pre-issue FY17 EPS). Following
positives gave us comfort in the issue and its valuation: a) Dixon has been able to
capture new product OEM contracts from its existing clients b) Traction in the
original development and Reverse logistic which is helping in improving the
blended margin c) Expansion in new product ranges like CCTVs & DVRs. Finally,
despite its thin margins, Dixon reported a strong return on capital of 33.3% in
FY2017.
Upon its listing, shares of Dixon appreciated by 63.6% to the IPO price and closed
on the price of `2,890. At this, Dixon is trading at P/E multiple of 65.50x of FY17
earnings. Presently, branded consumer durable companies are valued at this
valuation multiple and Dixon is an electronic manufacturing contractor. We believe
that such high valuation captures all the positives in the stock hence, we
recommend to book profit on Dixon technologies.
Economic and Political News
FDI likely to rise further after GST: Moody’s
Hasmukh Adhia-led panel to meet tomorrow on exporters' issues post GST
Finance ministry cuts plan spend to bare minimum
Govt. must have clarity on what it wants from auto industry: Vinod Dasari
Corporate News
Mahanadi Coalfields may face Rs 20,000 crore penalty
Two wheelers to lead electric vehicle market in India
Mahindra & Mahindra, Ford team up for technologies, distribution
IFC to invest Rs 320 cr in Mahindra Lifespace industrial parks
Sebi allows Reits, InvITs to issue debt securities
Market Outlook
September 19, 2017
Top Picks
Market Cap
CMP
Target
Upside
Company
Rationale
(` Cr)
(`)
(`)
(%)
Strong growth in domestic business due to its leadership
in acute therapeutic segment. Alkem expects to launch
Alkem Laboratories
21,618
1,808
2,161
19.5
more products in USA, which bodes for its international
business.
We expect the company would report strong profitability
Asian Granito
1,413
470
495
5.4
owing to better product mix, higher B2C sales and
amalgamation synergy.
Favorable outlook for the AC industry to augur well for
Cooling products business which is out pacing the
Blue Star
7,530
786
807
2.6
market growth. EMPPAC division's profitability to improve
once operating environment turns around.
With a focus on the low and medium income (LMI)
consumer segment, the company has increased its
Dewan Housing Finance
18,877
602
610
1.3
presence in tier-II & III cities where the growth
opportunity is immense.
Loan growth is likely to pick up after a sluggish FY17.
Karur Vysya Bank
9,606
159
180
13.2
Lower credit cost will help in strong bottom-line growth.
Increasing share of CASA will help in NIM improvement.
High order book execution in EPC segment, rising B2C
KEI Industries
2,617
336
371
10.3
sales and higher exports to boost the revenues and
profitability
Expected to benefit from the lower capex requirement
Music Broadcast
2,241
393
434
10.5
and 15 year long radio broadcast licensing.
Massive capacity expansion along with rail advantage at
Navkar Corporation
2,769
194
265
36.5
ICD as well CFS augurs well for the company
Strong brands and distribution network would boost
Siyaram Silk Mills
2,152
2,295
2,500
8.9
growth going ahead. Stock currently trades at an
inexpensive valuation.
Market leadership in Hindi news genre and no.
2
viewership ranking in English news genre, exit from the
TV Today Network
1,935
324
344
6.0
radio business, and anticipated growth in ad spends by
corporates to benefit the stock.
After GST, the company is expected to see higher
volumes along with improving product mix. The Gujarat
Maruti Suzuki
2,46,330
8,154
8,658
6.2
plant will also enable higher operating leverage which
will be margin accretive.
We expect loan book to grow at 24.3% over next two
GIC Housing
2,965
551
655
19.0
year; change in borrowing mix will help in NIM
improvement..
Source: Company, Angel Research
Market Outlook
September 19, 2017
Key Upcoming Events
Global economic events release calendar
Bloomberg Data
Date
Time
Country
Event Description
Unit
Period
Last Reported
Estimated
Sep 19, 2017
6:00 PMUS
Housing Starts
Thousands
Aug
1,155.00
1,174.00
7:30 PMUS
Existing home sales
Million
Aug
5.44
5.46
Sep 20, 2017
6:00 PMUS
Building permits
Thousands
Aug
1,230.00
1,220.00
11:30 PMUS
FOMC rate decision
%
Sep 20
1.25
1.25
Sep 21, 2017
1:00 PMGermany
PMI Services
Value
Sep P
53.50
53.70
6:00 PMUS
Initial Jobless claims
Thousands
Sep 16
284.00
300.00
Sep 22, 2017
7:30 PMEuro Zone
Euro-Zone Consumer Confidence
Value
Sep A
(1.50)
(1.50)
1:00 PMGermany
PMI Manufacturing
Value
Sep P
59.30
59.00
Sep 26, 2017
7:30 PMUS
Consumer Confidence
S.A./ 1985=100
Sep
122.90
119.00
7:30 PMUS
New home sales
Thousands
Aug
571.00
600.00
Sep 28, 2017
6:00 PMUS
GDP Qoq (Annualised)
% Change
2Q T
3.00
3.20
Sep 29, 2017
1:25 PMGermany
Unemployment change (000's)
Thousands
Sep
(5.00)
2:00 PMUK
GDP (YoY)
% Change
2Q F
1.70
Sep 30, 2017
6:30 AMChina
PMI Manufacturing
Value
Sep
51.70
Oct 02, 2017
2:00 PMUK
PMI Manufacturing
Value
Sep
56.90
Oct 04, 2017
2:30 PMIndia
RBI Reverse Repo rate
%
Oct 4
5.75
2:30 PMIndia
RBI Cash Reserve ratio
%
Oct 4
4.00
2:30 PMIndia
RBI Repo rate
%
Oct 4
6.00
Oct 06, 2017
6:00 PMUS
Change in Nonfarm payrolls
Thousands
Sep
156.00
6:00 PMUS
Unnemployment rate
%
Sep
4.40
Oct 10, 2017
India
Imports YoY%
% Change
Sep
21.00
India
Exports YoY%
% Change
Sep
10.30
2:00 PMUK
Industrial Production (YoY)
% Change
Aug
0.40
Oct 12, 2017
US
Producer Price Index (mom)
% Change
Sep
0.50
Source: Bloomberg, Angel Research
Market Outlook
September 19, 2017
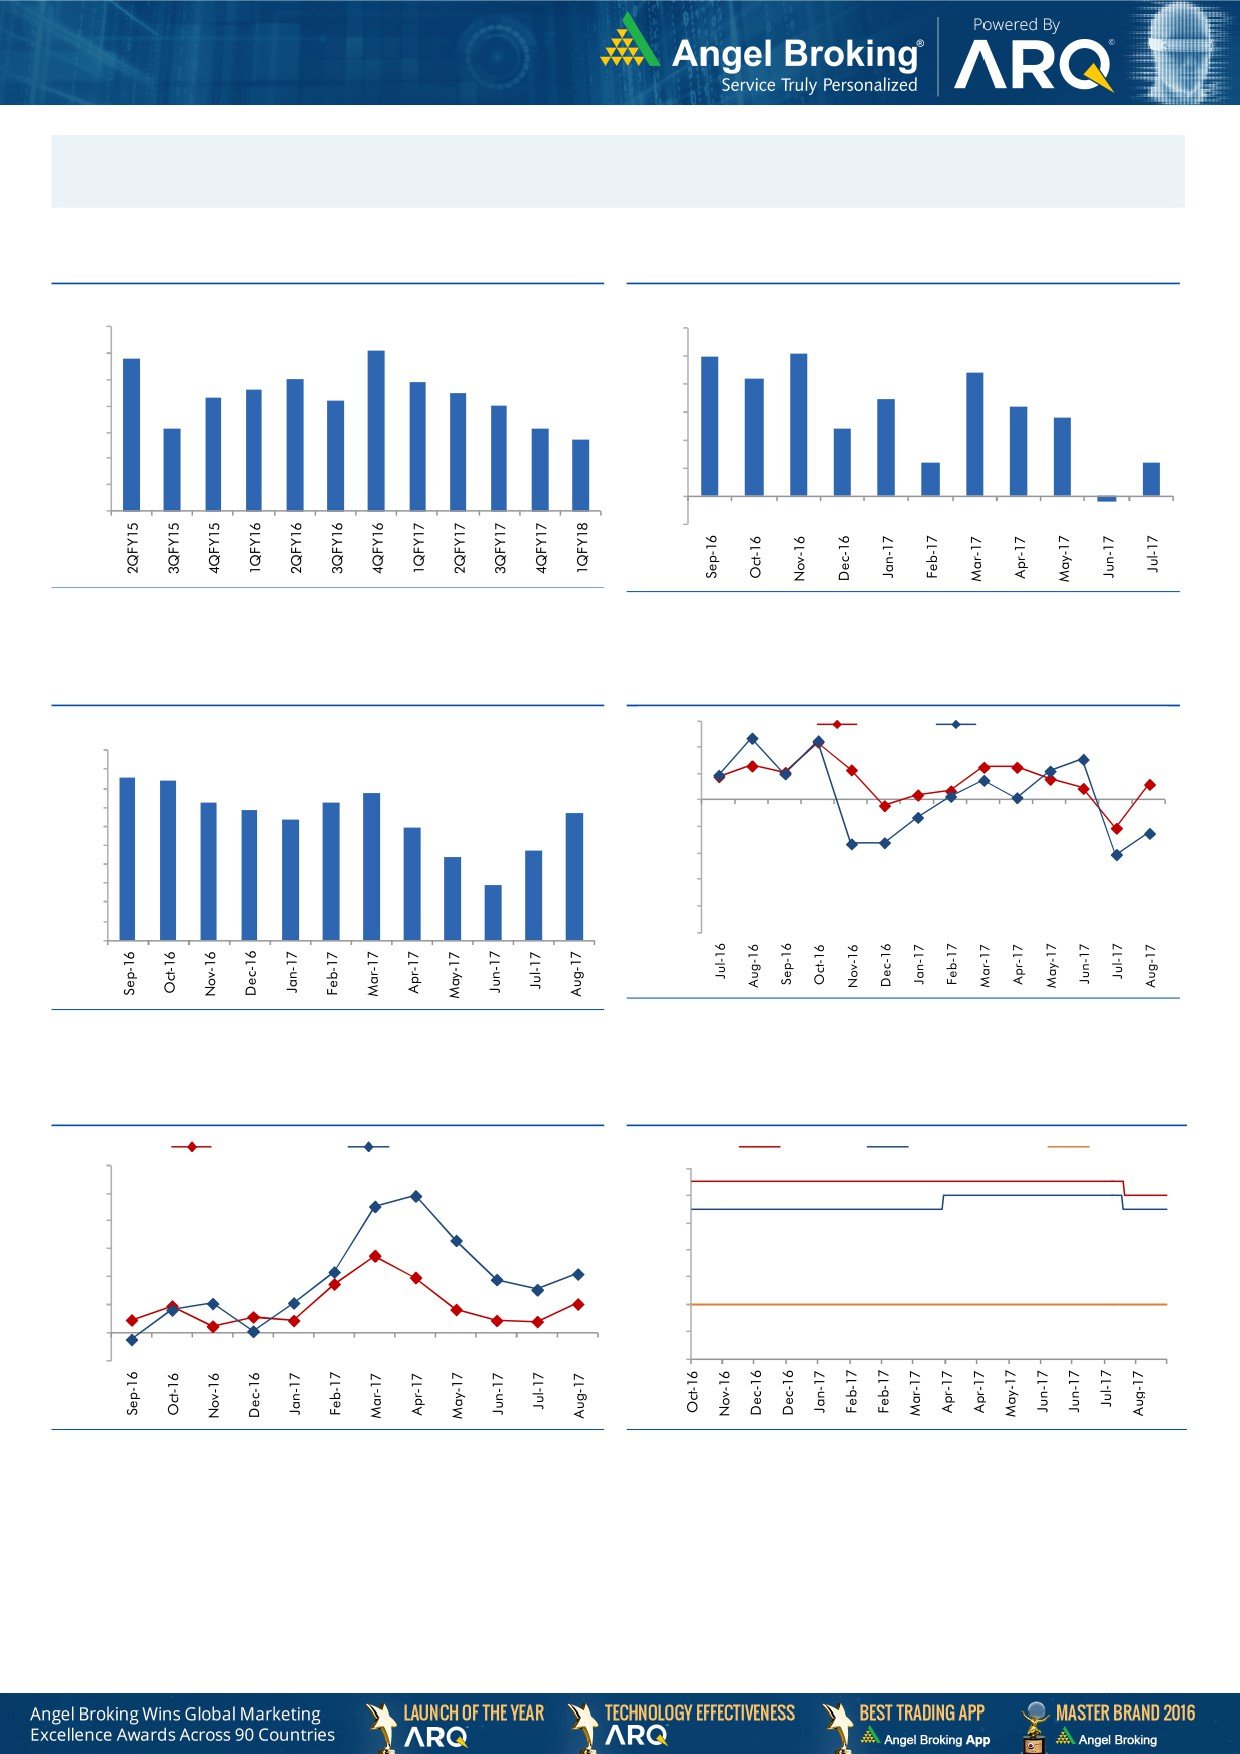
Macro watch
Exhibit 1: Quarterly GDP trends
Exhibit 2: IIP trends
(%)
(%)
10.0
6.0
9.1
5.1
8.8
5.0
9.0
5.0
4.4
8.0
7.9
4.2
7.6
7.5
8.0
7.3
3.5
7.2
7.0
4.0
3.2
2.8
7.0
6.1
6.1
3.0
2.4
5.7
6.0
2.0
1.2
1.2
5.0
1.0
4.0
-
3.0
(1.0)
(0.2)
Source: CSO, Angel Research
Source: MOSPI, Angel Research
Exhibit 3: Monthly CPI inflation trends
Exhibit 4: Manufacturing and services PMI
56.0
Mfg. PMI
Services PMI
(%)
5.0
54.0
4.3
4.2
4.5
3.9
52.0
4.0
3.6
3.7
3.4
3.4
3.2
50.0
3.5
3.0
3.0
48.0
2.4
2.2
2.5
46.0
2.0
1.5
1.5
44.0
1.0
42.0
0.5
40.0
-
Source: Market, Angel Research; Note: Level above 50 indicates expansion
Source: MOSPI, Angel Research
Exhibit 5: Exports and imports growth trends
Exhibit 6: Key policy rates
(%)
Exports yoy growth
Imports yoy growth
(%)
Repo rate
Reverse Repo rate
CRR
60.0
6.50
50.0
6.00
40.0
5.50
30.0
5.00
20.0
4.50
10.0
4.00
0.0
3.50
(10.0)
3.00
Source: Bloomberg, Angel Research
Source: RBI, Angel Research
Market Outlook
September 19, 2017
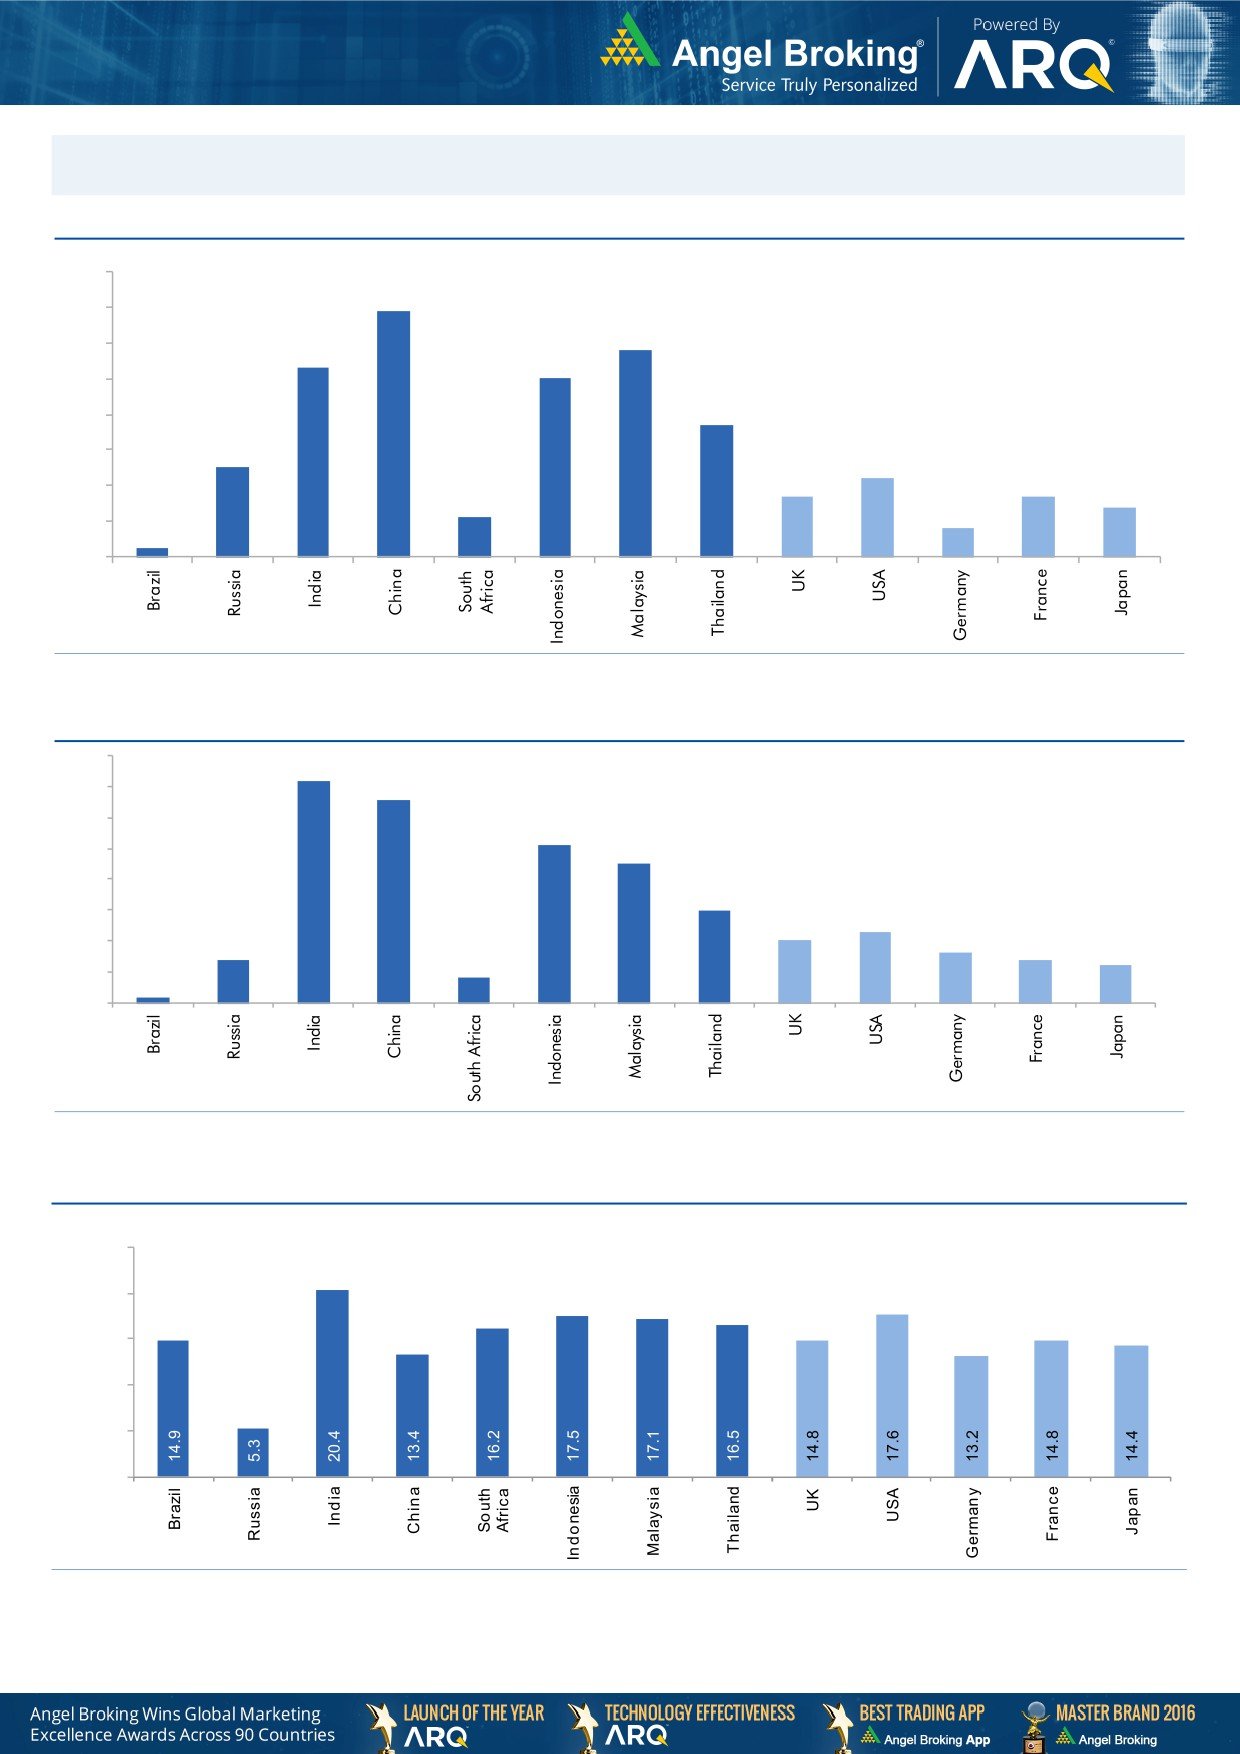
Global watch
Exhibit 1: Latest quarterly GDP Growth (%, yoy) across select developing and developed countries
(%)
8.0
6.9
7.0
5.8
6.0
5.3
5.0
5.0
1.1
3.7
4.0
2.5
3.0
2.2
1.7
1.7
2.0
1.4
0.8
1.0
0.3
-
Source: Bloomberg, Angel Research
Exhibit 2: 2017 GDP Growth projection by IMF (%, yoy) across select developing and developed countries
(%)
7.2
6.6
7.0
6.0
5.1
5.0
4.5
4.0
3.0
3.0
2.3
2.0
1.4
1.6
2.0
1.4
1.2
0.2
0.8
1.0
-
Source: IMF, Angel Research
Exhibit 3: One year forward P-E ratio across select developing and developed countries
(x)
25.0
20.0
15.0
10.0
5.0
-
Source: IMF, Angel Research
Market Outlook
September 19, 2017
Exhibit 4: Relative performance of indices across globe
Returns (%)
Country
Name of index
Closing price
1M
3M
1YR
Brazil
Bovespa
75,990
10.8
22.9
33.3
Russia
Micex
2,059
6.0
10.7
3.3
India
Nifty
10,153
2.6
6.0
16.3
China
Shanghai Composite
3,363
2.9
7.1
8.8
South Africa
Top 40
49,737
1.4
9.7
8.9
Mexico
Mexbol
50,258
(2.4)
1.5
8.8
Indonesia
LQ45
980
1.3
2.5
7.0
Malaysia
KLCI
1,784
0.7
(0.0)
5.6
Thailand
SET 50
1,074
7.7
8.5
19.4
USA
Dow Jones
22,331
1.2
4.3
22.9
UK
FTSE
7,253
(2.4)
(3.6)
6.2
Japan
Nikkei
19,910
0.9
0.4
17.4
Germany
DAX
12,559
2.8
(2.1)
17.5
France
CAC
5,229
1.5
(1.3)
18.6
Source: Bloomberg, Angel Research
Stock Watch
September 19, 2017
Company Name
Reco
CMP
Target
Mkt Cap
Sales ( Čcr )
OPM(%)
EPS (Č)
PER(x)
P/BV(x)
RoE(%)
EV/Sales(x)
(Č)
Price ( Č)
( Č cr )
FY18E FY19E
FY18E
FY19E
FY18E
FY19E
FY18E
FY19E
FY18E
FY19E
FY18E
FY19E
FY18E
FY19E
Agri / Agri Chemical
Rallis
Reduce
222
209
4,310
1,873
2,099
15.0
15.0
9.5
10.5
23.3
21.1
3.5
3.2
15.8
16.0
2.2
2.0
United Phosphorus
Neutral
834
-
42,383
18,922
21,949
18.0
18.5
36.2
45.6
23.1
18.3
4.8
4.0
22.7
23.8
2.4
2.0
Auto & Auto Ancillary
Ashok Leyland
Accumulate
119
127
34,679
23,339
27,240
10.1
10.8
4.7
6.2
25.5
19.1
5.1
4.5
20.0
23.6
1.4
1.2
Bajaj Auto
Neutral
3,130
-
90,566
23,936
27,955
19.5
20.1
142.7
167.3
21.9
18.7
4.8
4.3
21.8
22.8
3.4
2.8
Bharat Forge
Neutral
1,248
-
29,061
7,637
8,755
21.7
23.2
36.1
47.3
34.6
26.4
6.2
5.3
18.5
20.8
3.7
3.1
Eicher Motors
Neutral
32,766
-
89,198
19,043
22,837
19.5
19.9
835.4
1,019.0
39.2
32.2
14.7
11.3
40.9
37.8
4.6
3.7
Gabriel India
Neutral
212
-
3,045
1,782
2,033
9.7
10.2
7.1
8.9
29.9
24.0
6.0
5.1
21.0
22.2
1.7
1.4
Hero Motocorp
Neutral
3,951
-
78,901
32,239
36,878
16.0
15.6
184.4
206.5
21.4
19.1
6.7
5.9
31.3
30.7
2.2
1.9
Jamna Auto Industries Neutral
257
-
2,048
1,441
1,662
14.4
14.8
13.9
17.6
18.5
14.6
5.0
4.1
30.0
31.0
1.4
1.2
Mahindra and Mahindra Neutral
1,295
-
80,422
46,971
53,816
13.6
14.0
67.7
79.8
19.1
16.2
2.7
2.4
15.0
15.9
1.6
1.3
Maruti
Accumulate
8,154
8,658
246,330
81,825
101,245
15.0
15.0
283.5
356.0
28.8
22.9
6.3
5.1
21.9
22.4
2.7
2.1
Minda Industries
Neutral
857
-
7,405
4,328
5,084
11.0
11.9
27.3
36.4
31.5
23.5
6.7
5.2
23.1
25.6
1.8
1.5
Motherson Sumi
Neutral
333
-
70,113
55,937
64,445
10.8
11.4
16.9
21.1
19.7
15.8
4.4
4.5
25.2
25.4
1.3
1.1
Tata Motors
Neutral
405
-
117,039
303,167
343,649
11.8
13.8
33.1
54.7
12.3
7.4
2.0
1.6
16.9
23.0
0.4
0.4
TVS Motor
Neutral
664
-
31,529
13,992
16,216
9.0
9.4
17.1
20.3
38.9
32.7
10.3
8.0
29.7
27.7
2.2
1.8
Amara Raja Batteries
Accumulate
775
858
13,240
6,140
7,122
14.3
15.6
29.3
39.0
26.5
19.9
4.5
3.8
17.1
19.0
2.2
1.8
Exide Industries
Neutral
224
-
19,061
8,689
9,854
15.1
15.2
9.7
11.0
23.2
20.4
4.1
3.6
15.7
16.1
1.9
1.7
Apollo Tyres
Neutral
262
-
13,319
15,739
17,326
13.3
14.6
20.4
26.7
12.8
9.8
1.6
1.4
20.4
26.7
1.1
1.0
Ceat
Neutral
1,792
-
7,247
6,661
7,717
11.1
14.2
116.2
178.2
15.4
10.1
2.7
2.2
15.2
21.3
1.2
1.0
JK Tyres
Neutral
150
-
3,395
8,318
9,239
16.2
16.4
21.0
27.5
7.2
5.4
1.4
1.1
19.1
20.4
0.9
0.7
Swaraj Engines
Neutral
2,048
-
2,544
788
889
16.4
16.5
71.6
81.0
28.6
25.3
8.3
7.7
29.6
31.0
2.9
2.5
Subros
Neutral
246
-
1,476
1,855
2,135
11.6
11.8
10.3
14.7
24.0
16.8
3.7
3.1
15.8
19.1
1.0
0.9
Capital Goods
BEML
Neutral
1,852
-
7,714
4,286
5,194
7.1
8.2
42.9
58.1
43.2
31.9
3.5
3.2
7.6
8.7
1.9
1.5
Bharat Electronics
Neutral
193
-
43,076
10,258
12,470
19.6
19.5
7.3
8.6
26.4
22.4
0.5
0.5
20.4
21.9
3.7
3.0
Voltas
Neutral
551
-
18,245
6,778
8,004
9.6
11.0
17.1
22.4
32.3
24.6
7.7
6.7
17.7
19.8
2.4
2.0
BHEL
Neutral
133
-
32,590
33,200
39,167
6.8
9.5
6.2
11.2
21.5
11.9
1.0
0.9
4.6
8.0
0.6
0.4
Blue Star
Accumulate
786
850
7,530
5,101
5,997
6.0
7.0
17.9
26.6
43.9
29.6
9.4
8.6
21.9
29.0
1.5
1.3
CG Power and Industrial
Neutral
82
-
5,155
6,555
7,292
7.5
7.5
-
0.8
8,225.0
102.8
1.3
1.3
0.1
1.2
0.9
0.8
Solutions
Greaves Cotton
Neutral
141
-
3,441
1,778
1,993
14.7
15.1
8.1
9.1
17.4
15.5
3.9
3.7
21.8
23.6
1.7
1.5
Stock Watch
September 19, 2017
Company Name
Reco
CMP
Target
Mkt Cap
Sales ( Čcr )
OPM(%)
EPS (Č)
PER(x)
P/BV(x)
RoE(%)
EV/Sales(x)
(Č)
Price ( Č)
( Č cr )
FY18E FY19E
FY18E
FY19E
FY18E
FY19E
FY18E
FY19E
FY18E
FY19E
FY18E
FY19E
FY18E
FY19E
Capital Goods
KEC International
Accumulate
314
350
8,064
9,779
11,113
9.4
9.8
14.2
18.2
22.1
17.2
4.2
3.5
21.1
22.1
1.1
1.0
KEI Industries
Accumulate
336
371
2,617
3,001
3,391
10.0
10.0
13.0
16.1
25.9
20.9
4.7
3.9
18.2
18.7
1.0
0.9
Thermax
Neutral
944
-
11,245
4,125
4,747
10.3
10.8
26.7
31.5
35.4
30.0
4.0
3.6
11.2
12.0
2.5
2.1
VATech Wabag
Accumulate
640
681
3,496
3,867
4,126
9.6
10.0
34.9
39.8
18.4
16.1
3.0
2.6
17.7
17.5
0.9
0.8
Cement
ACC
Neutral
1,824
-
34,254
12,255
13,350
13.5
14.3
58.0
66.2
31.5
27.6
3.7
3.5
11.5
12.2
2.8
2.5
Ambuja Cements
Neutral
282
-
56,015
10,250
11,450
17.5
19.0
7.2
8.3
39.2
34.0
2.8
2.7
7.0
7.8
5.2
4.6
India Cements
Neutral
190
-
5,849
6,135
6,750
14.8
15.2
8.5
11.5
22.3
16.5
1.1
1.1
4.8
6.2
1.3
1.1
JK Cement
Neutral
1,020
-
7,128
4,150
4,775
19.2
20.0
49.0
63.5
20.8
16.1
3.3
2.8
17.0
18.5
2.2
1.8
J K Lakshmi Cement
Neutral
427
-
5,024
3,422
3,757
15.5
17.0
13.5
23.2
31.6
18.4
3.3
2.8
10.8
15.5
1.9
1.6
Orient Cement
Neutral
160
-
3,281
2,215
3,233
16.8
17.0
5.9
6.9
27.1
23.2
2.1
1.9
10.8
10.1
2.5
1.6
UltraTech Cement
Neutral
4,201
-
115,326
28,250
35,150
20.2
23.5
77.5
122.2
54.2
34.4
4.6
4.1
9.6
14.8
4.6
3.6
Construction
KNR Constructions
Neutral
205
-
2,889
1,846
2,203
14.5
14.5
12.1
13.7
17.0
15.1
0.9
0.8
17.5
16.7
1.6
1.3
Larsen & Toubro
Neutral
1,238
-
173,360
95,787
109,476
10.2
11.6
44.5
50.8
27.9
24.4
3.5
3.2
12.9
13.1
2.4
2.1
Gujarat Pipavav Port
Neutral
146
-
7,051
739
842
61.6
62.7
5.1
6.2
28.6
23.7
3.6
3.5
12.7
14.9
9.0
7.8
PNC Infratech
Accumulate
133
143
3,409
2,040
2,935
13.0
13.0
6.4
9.0
20.8
14.8
0.5
0.5
9.7
12.2
1.7
1.2
Simplex Infra
Neutral
482
-
2,385
6,012
6,619
11.6
11.7
21.1
31.0
22.9
15.6
1.6
1.5
6.5
8.6
0.9
0.8
Sadbhav Engineering
Neutral
291
-
4,994
3,823
4,426
10.7
10.8
10.3
11.8
28.3
24.7
3.4
3.0
10.1
10.5
1.6
1.4
NBCC
Neutral
214
-
19,220
9,099
12,706
6.4
6.4
7.3
9.6
29.3
22.3
1.3
1.0
27.5
30.5
2.0
1.4
MEP Infra
Neutral
117
-
1,903
2,403
2,910
18.3
16.8
2.4
6.1
49.8
19.3
18.9
12.7
35.2
55.8
2.0
1.6
SIPL
Neutral
98
-
3,462
2,060
2,390
46.8
47.7
(5.8)
(3.1)
3.7
4.2
(14.2)
(2.3)
6.4
6.0
Engineers India
Neutral
159
-
10,688
1,795
2,611
21.1
22.4
5.9
8.1
26.9
19.6
1.9
1.9
12.9
16.1
4.3
2.8
Financials
Axis Bank
Accumulate
524
580
125,526
32,558
35,843
3.5
3.2
27.8
41.0
18.8
12.8
2.0
1.8
11.4
14.9
-
-
Bank of Baroda
Neutral
145
-
33,502
22,533
26,079
2.4
2.4
12.0
20.9
12.1
7.0
0.8
0.7
6.6
11.0
-
-
Canara Bank
Neutral
347
-
20,717
17,925
20,235
2.0
2.1
18.5
36.5
18.8
9.5
0.7
0.7
3.4
6.2
-
-
Can Fin Homes
Neutral
2,820
-
7,506
586
741
3.5
3.5
107.8
141.0
26.2
20.0
5.7
4.6
24.1
25.6
-
-
Cholamandalam Inv. &
Accumulate
1,169
1,230
18,276
2,826
3,307
6.3
6.3
53.7
64.6
21.8
18.1
3.7
3.2
18.3
18.9
-
-
Fin. Co.
Dewan Housing Finance Neutral
602
-
18,877
2,676
3,383
2.4
2.7
37.4
49.7
16.1
12.1
2.1
1.9
13.8
16.2
-
-
Equitas Holdings
Buy
161
235
5,468
1,125
1,380
9.6
9.8
1.5
6.0
107.6
26.9
2.5
2.3
2.4
8.2
-
-
Federal Bank
Accumulate
117
125
22,772
4,896
5,930
2.8
3.1
5.4
7.6
21.8
15.4
1.9
1.7
8.5
11.0
-
-
Stock Watch
September 19, 2017
Company Name
Reco
CMP
Target
Mkt Cap
Sales ( Čcr )
OPM(%)
EPS (Č)
PER(x)
P/BV(x)
RoE(%)
EV/Sales(x)
(Č)
Price ( Č)
( Č cr )
FY18E FY19E
FY18E
FY19E
FY18E
FY19E
FY18E
FY19E
FY18E
FY19E
FY18E
FY19E
FY18E
FY19E
Financials
GIC Housing
Buy
551
655
2,965
376
477
3.6
3.7
33.0
40.0
16.7
13.8
3.0
2.5
20.0
23.0
-
-
HDFC Bank
Neutral
1,860
-
480,139
55,236
63,253
4.5
4.4
68.9
82.4
27.0
22.6
4.7
3.9
18.7
18.5
-
-
ICICI Bank
Accumulate
293
315
187,736
42,361
51,378
3.6
3.9
18.4
25.7
15.9
11.4
1.7
1.7
11.3
15.0
-
-
Karur Vysya Bank
Accumulate
159
180
9,606
3,289
3,630
3.7
3.9
10.8
14.1
14.7
11.3
1.8
1.6
12.5
14.7
-
-
LIC Housing Finance
Neutral
657
-
33,179
4,895
6,332
3.4
3.7
50.7
66.8
13.0
9.9
2.6
2.1
21.7
23.8
-
-
Punjab Natl.Bank
Neutral
145
-
30,781
23,708
25,758
2.1
2.1
5.9
16.4
24.6
8.8
0.7
0.7
3.0
8.3
-
-
RBL Bank
Neutral
537
-
22,204
2,309
2,888
2.6
2.5
16.4
19.1
32.9
28.2
4.1
3.7
13.3
13.8
-
-
Repco Home Finance
Buy
648
825
4,056
496
597
4.4
4.2
38.5
48.7
16.9
13.3
3.0
2.5
19.6
20.6
-
-
South Ind.Bank
Neutral
29
-
5,260
3,195
3,567
3.0
3.1
3.0
3.8
9.7
7.6
1.0
0.9
10.5
11.9
-
-
St Bk of India
Neutral
270
-
233,195
105,827
121,056
2.4
2.5
16.1
25.6
16.8
10.6
1.3
1.2
6.6
9.9
-
-
Union Bank
Neutral
137
-
9,974
14,650
16,225
2.3
2.3
23.1
32.5
5.9
4.2
0.5
0.4
7.1
9.2
-
-
Yes Bank
Neutral
1,859
-
85,127
11,088
13,138
3.0
2.9
84.0
99.3
22.1
18.7
3.4
3.0
16.3
16.8
-
-
FMCG
Akzo Nobel India
Neutral
1,819
-
8,723
3,164
3,607
13.8
13.7
58.6
67.9
31.0
26.8
7.6
6.7
24.5
25.1
2.6
2.3
Asian Paints
Neutral
1,256
-
120,461
17,603
20,615
18.6
18.6
2,128.9
2,543.3
0.6
0.5
12.4
10.5
28.0
28.9
6.6
5.6
Britannia
Neutral
4,390
-
52,711
9,690
11,278
14.8
15.4
84.0
101.0
52.3
43.5
19.0
15.1
40.6
39.0
5.4
4.6
Colgate
Neutral
1,140
-
30,998
4,420
5,074
24.9
25.3
28.6
32.8
39.9
34.8
15.7
12.7
43.8
40.5
6.8
5.9
Dabur India
Neutral
309
-
54,352
8,346
9,344
19.6
19.9
7.8
9.0
39.6
34.3
8.0
7.2
25.2
24.8
6.1
5.4
GlaxoSmith Con*
Neutral
5,065
-
21,303
5,072
5,760
18.2
18.4
176.3
199.2
28.7
25.4
6.1
5.5
21.2
21.7
3.5
3.0
Godrej Consumer
Neutral
944
-
64,314
10,171
11,682
20.8
21.5
21.7
27.1
43.5
34.8
9.8
8.4
22.3
23.4
6.4
5.6
HUL
Neutral
1,280
-
276,945
37,077
41,508
20.3
21.8
5,189.9
6,318.5
0.3
0.2
39.0
33.3
74.8
82.0
7.3
6.5
ITC
Neutral
267
-
324,971
44,588
49,853
37.0
37.3
9.6
11.0
27.8
24.3
6.8
6.5
25.1
27.3
6.8
6.0
Marico
Neutral
331
-
42,708
6,788
7,766
18.5
19.2
7.1
8.5
46.6
38.9
16.3
14.0
36.9
38.0
6.1
5.3
Nestle*
Neutral
7,291
-
70,294
10,083
11,182
20.0
20.9
119.7
141.3
60.9
51.6
214.7
196.2
36.7
39.8
6.7
5.9
Tata Global
Neutral
213
-
13,462
7,121
7,641
11.9
12.3
6.9
8.0
30.9
26.7
2.1
2.0
6.8
7.2
1.7
1.6
Procter & Gamble
Neutral
8,394
-
27,247
3,034
3,579
27.1
27.7
167.7
198.8
50.1
42.2
13.4
11.6
28.8
29.5
8.4
7.0
Hygiene
IT
HCL Tech^
Accumulate
898
1,014
128,136
52,342
57,053
20.9
20.9
62.8
67.6
14.3
13.3
3.2
2.7
22.4
20.6
2.1
1.8
Infosys
Buy
908
1,179
208,668
73,963
80,619
26.0
26.0
64.4
69.3
14.1
13.1
2.8
2.6
19.7
19.6
2.3
2.0
TCS
Accumulate
2,499
2,651
492,420
127,403
138,870
27.6
27.6
144.5
156.0
17.3
16.0
5.1
4.8
29.7
29.8
3.5
3.2
Tech Mahindra
Buy
445
533
43,398
31,015
33,496
15.0
15.0
35.6
38.1
12.5
11.7
2.1
2.0
17.0
16.3
1.2
1.0
Stock Watch
September 19, 2017
Company Name
Reco
CMP
Target
Mkt Cap
Sales ( Čcr )
OPM(%)
EPS (Č)
PER(x)
P/BV(x)
RoE(%)
EV/Sales(x)
(Č)
Price ( Č)
( Č cr )
FY18E FY19E
FY18E
FY19E
FY18E
FY19E
FY18E
FY19E
FY18E
FY19E
FY18E
FY19E
FY18E
FY19E
IT
Wipro
Neutral
289
-
140,453
58,536
61,858
20.3
20.3
18.2
19.1
15.9
15.1
2.5
2.1
14.6
13.4
2.3
2.2
Media
D B Corp
Neutral
365
-
6,722
2,404
2,625
30.5
31.5
23.7
26.9
15.4
13.6
3.6
3.1
23.5
22.8
2.6
2.4
HT Media
Neutral
103
-
2,408
2,589
2,830
15.1
15.4
8.3
10.9
12.5
9.5
1.0
0.9
8.4
10.4
0.5
0.3
Jagran Prakashan
Buy
185
225
6,048
2,541
2,835
28.5
28.7
12.7
14.1
14.6
13.1
3.0
2.6
21.3
21.4
2.2
1.9
Sun TV Network
Neutral
850
-
33,479
3,238
3,789
51.9
55.1
30.9
38.0
27.5
22.4
7.8
6.9
30.0
31.0
9.9
8.3
Hindustan Media
Neutral
269
-
1,975
1,002
1,074
23.3
23.5
29.2
33.8
9.2
8.0
1.4
1.2
15.6
15.4
1.0
0.7
Ventures
TV Today Network
Accumulate
324
344
1,935
667
727
27.7
27.7
18.6
20.1
17.5
16.2
2.7
2.8
15.6
17.3
2.4
2.3
Music Broadcast Limited Accumulate
393
434
2,241
271
317
91.0
109.0
6.0
10.0
65.5
39.3
4.1
3.7
6.5
9.3
7.9
6.5
Metals & Mining
Coal India
Neutral
265
-
164,372
82,301
91,235
17.0
18.0
17.1
20.5
15.5
12.9
2.9
2.7
45.0
55.0
1.7
1.5
Hind. Zinc
Neutral
310
-
130,879
22,108
24,555
57.0
58.0
22.1
26.3
14.0
11.8
4.5
3.7
32.0
35.0
4.9
4.1
Hindalco
Neutral
249
-
55,821
102,350
105,355
13.5
14.5
21.5
24.5
11.6
10.2
1.6
1.3
15.0
15.2
1.1
1.1
JSW Steel
Neutral
263
-
63,464
64,500
68,245
21.1
21.5
20.1
21.2
13.1
12.4
2.4
2.1
-
-
1.7
1.6
NMDC
Neutral
133
-
42,143
10,209
11,450
47.0
48.0
11.1
12.1
12.0
11.0
1.7
1.6
-
-
3.6
3.3
SAIL
Neutral
62
-
25,462
54,100
63,555
3.0
10.0
(10.0)
1.5
41.1
0.8
0.8
-
-
1.5
1.3
Vedanta
Neutral
326
-
121,125
81,206
87,345
28.0
29.0
26.5
33.5
12.3
9.7
2.8
2.4
-
-
2.2
1.9
Tata Steel
Neutral
673
-
65,368
121,445
126,500
16.2
17.2
65.4
81.3
10.3
8.3
1.6
1.4
-
-
1.1
0.9
Oil & Gas
GAIL
Neutral
401
-
67,762
53,115
52,344
14.2
15.3
30.0
31.1
13.4
12.9
1.7
1.5
-
-
1.0
1.0
ONGC
Neutral
165
-
212,262
83,111
84,934
44.2
44.9
16.4
16.9
10.1
9.8
1.2
1.1
-
-
2.4
2.4
Indian Oil Corp
Neutral
416
-
201,836
396,116
432,560
8.5
8.8
40.1
42.2
10.4
9.9
1.8
1.6
-
-
0.7
0.6
Reliance Industries
Neutral
845
-
549,831
257,711
267,438
17.0
18.2
89.1
89.5
9.5
9.5
0.9
0.8
-
-
1.8
1.7
Pharmaceuticals
Alembic Pharma
Buy
491
600
9,251
3,903
4,584
18.2
19.2
21.8
27.2
22.5
18.0
4.1
3.4
19.8
20.6
2.4
2.0
Alkem Laboratories Ltd
Buy
1,808
2,161
21,618
6,901
7,850
18.4
19.1
85.0
100.5
21.3
18.0
4.3
3.6
20.2
20.1
3.1
2.7
Aurobindo Pharma
Accumulate
763
823
44,682
17,086
19,478
22.1
22.0
44.7
51.4
17.1
14.8
3.8
3.1
24.7
22.7
2.7
2.4
Aventis*
Neutral
4,051
-
9,331
2,508
2,862
16.8
16.8
139.9
153.8
29.0
26.3
4.2
3.4
23.5
25.8
3.3
2.7
Cadila Healthcare
Reduce
487
426
49,810
11,584
13,228
20.3
20.4
18.7
21.3
26.0
22.8
5.8
4.8
24.6
22.9
4.1
3.6
Cipla
Sell
570
458
45,871
16,619
19,437
15.4
16.2
19.7
24.3
28.9
23.5
3.3
2.9
12.0
13.2
2.9
2.5
Dr Reddy's
Neutral
2,245
-
37,215
15,844
17,973
17.6
18.2
91.7
111.0
24.5
20.2
2.8
2.5
11.9
13.0
2.6
2.3
GSK Pharma*
Neutral
2,410
-
20,410
3,260
3,651
15.0
18.0
46.1
58.6
52.3
41.1
10.7
11.1
20.0
26.5
6.2
5.6
Indoco Remedies
Sell
198
153
1,826
1,154
1,310
14.9
14.9
11.3
12.7
17.5
15.6
2.5
2.2
15.0
15.0
1.7
1.4
Stock Watch
September 19, 2017
Company Name
Reco
CMP
Target
Mkt Cap
Sales ( Čcr )
OPM(%)
EPS (Č)
PER(x)
P/BV(x)
RoE(%)
EV/Sales(x)
(Č)
Price ( Č)
( Č cr )
FY18E FY19E
FY18E
FY19E
FY18E
FY19E
FY18E
FY19E
FY18E
FY19E
FY18E
FY19E
FY18E
FY19E
Pharmaceuticals
Ipca labs
Accumulate
505
540
6,373
3,593
4,022
14.5
15.5
19.4
25.2
26.0
20.0
2.4
2.1
9.5
11.2
1.8
1.6
Lupin
Buy
1,010
1,467
45,611
18,657
21,289
21.3
23.3
52.8
66.7
19.1
15.1
2.9
2.5
16.3
17.5
2.5
2.0
Natco Pharma
Neutral
806
-
14,047
1,836
1,946
31.8
28.9
22.1
20.6
36.5
39.1
7.3
6.5
20.1
16.7
7.5
7.1
Sun Pharma
Accumulate
521
558
125,001
32,899
36,451
26.9
25.4
31.6
32.3
16.5
16.1
2.9
2.5
18.7
18.8
3.4
2.9
Syngene International
Accumulate
495
557
9,891
1,402
1,823
32.8
36.0
15.9
20.7
31.2
23.9
5.8
4.8
18.7
20.0
7.0
5.4
Power
Tata Power
Neutral
84
-
22,639
32,547
33,806
20.5
20.5
4.7
5.4
17.8
15.6
1.7
1.5
10.5
10.5
1.7
1.6
NTPC
Neutral
168
-
138,524
86,070
101,246
28.3
30.7
12.9
16.2
13.0
10.4
1.3
1.2
10.6
12.4
3.0
2.7
Power Grid
Neutral
215
-
112,427
29,183
32,946
89.7
90.0
18.0
20.8
12.0
10.3
2.0
1.8
17.7
18.2
7.8
7.2
Real Estate
Prestige Estate
Neutral
266
-
9,988
4,607
5,146
21.0
22.2
7.9
9.8
33.7
27.2
2.1
1.9
10.3
12.0
3.3
3.0
MLIFE
Neutral
507
-
2,601
487
590
12.3
17.8
21.0
31.2
24.1
16.3
1.3
1.2
5.2
7.4
4.1
3.3
Telecom
Bharti Airtel
Neutral
397
-
158,617
97,903
105,233
36.0
36.3
9.3
11.1
42.7
35.9
2.1
2.0
5.0
5.6
2.6
2.3
Idea Cellular
Neutral
83
-
29,775
35,012
37,689
27.1
27.7
(4.4)
(2.7)
1.3
1.3
(6.8)
(4.6)
2.2
1.9
zOthers
Abbott India
Neutral
4,071
-
8,650
3,244
3,723
14.9
16.1
167.5
209.4
24.3
19.4
5.4
4.5
23.7
24.8
2.3
1.9
Asian Granito
Neutral
470
-
1,413
1,169
1,286
12.5
12.5
16.0
19.7
29.4
23.8
3.1
2.8
10.7
11.6
1.4
1.3
Bajaj Electricals
Neutral
401
-
4,073
4,646
5,301
6.7
7.6
16.1
22.3
24.9
18.0
4.1
3.5
16.4
19.2
0.9
0.8
Banco Products (India)
Neutral
218
-
1,560
1,530
1,695
13.2
12.7
19.0
20.0
11.5
10.9
1.8
1.6
0.2
0.2
0.9
103.3
Coffee Day Enterprises
Neutral
245
-
5,040
3,494
3,913
17.4
18.0
4.8
5.7
-
42.9
2.2
2.1
-
0.1
1.9
1.7
Ltd
Elecon Engineering
Neutral
53
-
590
171
201
15.0
16.2
36.0
43.0
1.5
1.2
0.1
0.1
0.1
0.1
2.8
2.4
Garware Wall Ropes
Neutral
875
-
1,914
928
1,003
15.2
15.2
39.4
43.2
22.2
20.3
3.7
3.1
16.5
15.4
1.9
1.7
Goodyear India*
Neutral
837
-
1,930
1,717
1,866
11.8
12.3
47.9
49.8
17.5
16.8
2.7
2.3
15.6
15.7
0.8
117.3
Hitachi
Neutral
1,963
-
5,337
2,355
2,715
10.3
10.8
49.0
60.9
40.1
32.2
9.4
7.4
0.2
0.2
2.3
2.0
HSIL
Neutral
391
-
2,828
2,240
2,670
14.6
15.0
17.0
22.0
23.0
17.8
1.9
1.8
0.1
0.1
1.5
1.2
Interglobe Aviation
Neutral
1,166
-
42,169
22,570
27,955
14.2
15.0
63.6
81.8
18.4
14.3
9.7
8.2
0.5
0.6
1.5
1.2
Jyothy Laboratories
Neutral
424
-
7,700
1,781
2,044
14.1
15.0
9.4
10.5
45.3
40.4
9.6
9.1
0.2
0.2
4.5
3.9
Linc Pen & Plastics
Neutral
233
-
344
420
462
9.3
9.3
15.3
17.1
15.2
13.6
2.6
2.7
16.9
19.5
0.9
0.8
M M Forgings
Neutral
638
-
770
542
642
20.1
21.0
41.6
56.8
15.3
11.2
2.1
1.8
0.1
0.2
1.8
1.6
Mirza International
Neutral
171
-
2,058
1,148
1,285
18.0
18.0
8.0
9.4
21.3
18.3
3.5
3.0
16.3
16.1
2.0
1.7
Navkar Corporation
Buy
194
265
2,769
561
617
41.5
41.5
11.5
12.7
16.9
15.3
1.8
1.6
10.5
10.4
5.6
4.9
Nilkamal
Neutral
1,588
-
2,370
2,317
2,525
11.4
11.1
96.0
105.0
16.5
15.1
2.8
2.5
0.2
0.2
1.0
0.9
Stock Watch
September 19, 2017
Company Name
Reco
CMP
Target Mkt Cap
Sales ( Čcr )
OPM(%)
EPS (Č)
PER(x)
P/BV(x)
RoE(%)
EV/Sales(x)
(Č)
Price ( Č)
( Č cr )
FY18E FY19E FY18E FY19E FY18E FY19E FY18E FY19E FY18E FY19E FY18E FY19E FY18E FY19E
zOthers
Parag Milk Foods
Neutral
248
-
2,089
1,987
2,379
7.6
9.0
12.4
18.3
20.0
13.6
2.8
2.5
8.2
13.2
1.2
1.0
Radico Khaitan
Neutral
169
-
2,255
1,811
1,992
13.2
13.2
8.1
8.8
20.9
19.2
2.1
2.3
10.1
12.0
1.6
1.4
Relaxo Footwears
Neutral
534
-
6,418
1,981
2,310
13.7
14.5
12.0
15.5
44.5
34.5
8.7
7.0
0.2
0.2
3.3
2.8
Siyaram Silk Mills
Accumulate
2,295
2,500
2,152
1,769
1,981
12.7
12.7
113.1
131.1
20.3
17.5
3.1
2.7
15.5
15.5
1.4
1.2
Styrolution ABS India* Neutral
953
-
1,675
1,800
1,980
8.0
8.1
42.0
46.2
22.7
20.6
2.5
2.3
0.1
0.1
1.0
1.0
Surya Roshni
Neutral
309
-
1,355
4,870
5,320
7.7
7.8
22.8
28.1
13.6
11.0
1.8
1.6
0.1
0.1
0.5
0.4
TVS Srichakra
Neutral
3,094
-
2,369
2,729
2,893
12.7
12.5
248.5
265.0
12.5
11.7
3.5
2.9
0.3
0.3
0.9
0.8
Visaka Industries
Neutral
650
-
1,032
1,104
1,214
12.1
12.6
31.0
37.9
21.0
17.2
2.6
2.3
0.1
0.1
1.2
1.0
VIP Industries
Neutral
260
-
3,680
1,450
1,693
10.4
10.5
6.5
7.8
39.8
33.3
8.4
7.4
21.1
22.1
2.5
2.2
Navin Fluorine
Accumulate
656
730
3,233
945
1,154
22.4
22.6
28.7
34.8
22.9
18.9
3.8
3.2
-
-
2.9
2.3
Source: Company, Angel Research; Note: *December year end; #September year end; &October year end; Price as on September 18, 2017
Market Outlook
September 19, 2017
Research Team Tel: 022 - 39357800
DISCLAIMER
Angel Broking Private Limited (hereinafter referred to as “Angel”) is a registered Member of National Stock Exchange of India
Limited,Bombay Stock Exchange Limited and Metropolitan Stock Exchange Limited. It is also registered as a Depository Participant with
CDSL and Portfolio Manager with SEBI. It also has registration with AMFI as a Mutual Fund Distributor. Angel Broking Private Limited is a
registered entity with SEBI for Research Analyst in terms of SEBI (Research Analyst) Regulations, 2014 vide registration number
INH000000164. Angel or its associates has not been debarred/ suspended by SEBI or any other regulatory authority for accessing
/dealing in securities Market. Angel or its associates/analyst has not received any compensation / managed or
co-managed public offering of securities of the company covered by Analyst during the past twelve months.
This document is solely for the personal information of the recipient, and must not be singularly used as the basis of any investment
decision. Nothing in this document should be construed as investment or financial advice. Each recipient of this document should make
such investigations as they deem necessary to arrive at an independent evaluation of an investment in the securities of the companies
referred to in this document (including the merits and risks involved), and should consult their own advisors to determine the merits and
risks of such an investment.
Reports based on technical and derivative analysis center on studying charts of a stock's price movement, outstanding positions and
trading volume, as opposed to focusing on a company's fundamentals and, as such, may not match with a report on a company's
fundamentals. Investors are advised to refer the Fundamental and Technical Research Reports available on our website to evaluate the
contrary view, if any.
The information in this document has been printed on the basis of publicly available information, internal data and other reliable
sources believed to be true, but we do not represent that it is accurate or complete and it should not be relied on as such, as this
document is for general guidance only. Angel Broking Pvt. Limited or any of its affiliates/ group companies shall not be in any way
responsible for any loss or damage that may arise to any person from any inadvertent error in the information contained in this report.
Angel Broking Pvt. Limited has not independently verified all the information contained within this document. Accordingly, we cannot
testify, nor make any representation or warranty, express or implied, to the accuracy, contents or data contained within this document.
While Angel Broking Pvt. Limited endeavors to update on a reasonable basis the information discussed in this material, there may be
regulatory, compliance, or other reasons that prevent us from doing so.
This document is being supplied to you solely for your information, and its contents, information or data may not be reproduced,
redistributed or passed on, directly or indirectly.
Neither Angel Broking Pvt. Limited, nor its directors, employees or affiliates shall be liable for any loss or damage that may arise from
or in connection with the use of this information.